


🎶 Bruno Mars'
- Feb 4
- 7 min read
Updated: Mar 6
Last updated: February 4, 2026 — 10:30 PM PT (This article will be actively updated as Kalshi market odds move.)
Prediction markets are buzzing with excitement for Bruno Mars’ upcoming album The Romantic. Pricing on Kalshi offers a unique glimpse into how traders expect the album to perform in its debut week. Unlike Billboard headlines that combine streaming and album-equivalent units, Kalshi markets focus strictly on actual album sales thresholds. This allows traders to bet directly on how many albums will sell in the first week.
Here’s a breakdown of current odds and what they mean for traders and fans alike.
📈 Current Market Forecast
Kalshi traders currently project roughly 140,000 first-week album sales, with active contracts trading across multiple thresholds. Based on current pricing:
50K+ sales — Nearly certain
75K+ sales — Extremely likely
100K+ sales — Strong probability (~75%+)
125K+ sales — Still favored (~70%)
150K+ sales — Near coin flip (~40%)
175K+ sales — Possible but less likely (~30%)
200K+ sales — Lower probability (~25–30%)
Markets broadly agree that Bruno Mars will clear 100K sales, with debate centered on whether he lands closer to 125K or pushes toward 150K+.
💰 What the Odds Mean in Simple Terms
Each Kalshi contract pays $1 if correct. If a contract costs 40¢:
You pay $0.40
It pays $1 if correct
Profit = $0.60 per contract
For example, if 150K+ sales YES trades around 40¢:
$100 buys about 250 contracts
If sales exceed 150K, payout = $250
Profit ≈ $150
Lower thresholds pay less because they’re safer bets.
✅ Recommended Statistically Safe Bet
The most logical high-probability position right now is to:
👉 Bet YES on 100K+ First-Week Sales
Why:
Market probability around 75–80%
Does not require blockbuster performance
Bruno’s mainstream audience supports this level
Even moderate success likely clears this mark
Example payout:
If priced at 77¢:
$100 buys ~130 contracts
Payout ≈ $130
Profit ≈ $30
Returns are smaller, but the probability of success is higher.
🛡️ Using “NO” Contracts as Risk Hedges
Traders often reduce risk by combining YES bets with NO bets at higher thresholds.
Example hedge strategy
Core bet: Buy YES 100K+
Hedge bet: Buy NO 175K+
Why this works:
If sales land between 100K and 174K, both bets win.
If the album underperforms, the hedge reduces losses.
If the album massively overperforms, the hedge loses, but the core bet still wins.
Example hedge allocation
YES 100K+ — $100
NO 175K+ — $40
Possible outcomes:
Sales between 120K–160K → Both bets win, strong profit.
Sales under 100K → YES loses, NO wins, losses reduced.
Sales above 175K → YES wins, NO loses, still profitable overall.
This strategy narrows risk exposure.
📀 Why Expectations Are High
Bruno Mars has a history of strong debuts due to:
Massive crossover pop appeal
Radio and streaming dominance
Broad mainstream buying audience
Markets price in these strengths.
📱 Social Buzz Supports Strong Debut Expectations
Online discussion shows:
Heavy engagement whenever Bruno releases music
Strong anticipation across pop and R&B audiences
Cross-platform streaming dominance
This buzz aligns with market optimism.
📉 Where Traders Actually Disagree
Markets mostly agree Bruno clears 100K. The real debate is whether he lands:
Around 125K, or
Pushes into 150K+ territory.
That’s where profit differences emerge.
📈 Strategy Perspective
Common approaches traders take include:
Conservative: Bet YES 100K+
Balanced: Split capital between YES 100K+ and YES 125K+
Hedged: YES 100K+ combined with NO 175K+
Aggressive: Bet YES 150K+ or higher for larger payouts
🔄 Why Updates Matter
Prediction markets react to:
Singles performance
Media rollout momentum
Streaming indicators
Social buzz spikes
Odds often shift rapidly near release. This article will continue updating as pricing evolves.
🎤 Final Takeaway
Prediction markets currently expect Bruno Mars to deliver a strong debut. The only real question traders are asking is: How strong will it actually be? This question determines which contracts ultimately pay out.
📉
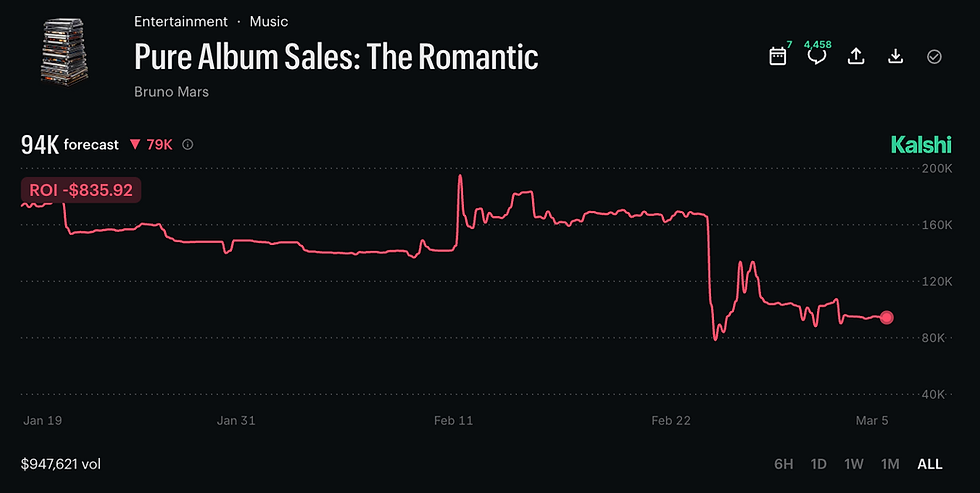
Position Update — Projection Crash Readjustment (Last Night 2/24)

⚠️ Projection Crash — Timeline of What Happened
🕔 5:45 PM EST — The market was holding steady near the previous projection range with relatively calm price action. Sentiment leaned toward higher pure-sales outcomes.
🕙 ~10:26 PM EST — First major breakdown. The projection abruptly dropped, cutting through prior support levels and triggering a rapid repricing across multiple sales thresholds. Liquidity moved quickly as traders reacted.
🕒 ~3:10 AM EST — Stabilization phase. Price action flattened, suggesting the market was temporarily absorbing the shock rather than continuing to spiral lower.
🕖 ~7:50 AM EST — Brief rebound spike. A fast upward move suggested new buyers stepped in or short-term traders attempted to catch the reset — but momentum faded shortly after.
🕧 12:27 PM EST — Post-crash consolidation. Projection settled around the high-90K range, showing the market had accepted a new baseline.
🔄 Our Position Readjustment (During the Crash)
As volatility accelerated, we made controlled adjustments rather than reacting emotionally:
Reduced exposure tied to higher projection outcomes during the sharp breakdown.
Shifted capital toward mid-range probability levels where pricing became more efficient after the drop.
Avoided overloading extreme “No” positions despite panic — these moves often reverse once liquidity normalizes.
This wasn’t a panic exit — it was a risk reset.
🧠 Why We Adjusted — Retail Reality vs Market Sentiment
From a record-store perspective, sudden projection crashes rarely mean demand suddenly disappeared. What we watch:
Physical buying habits don’t change overnight.
Retail indicators usually move slower than trading sentiment.
Fast market repricing often reflects order flow — not necessarily real-world sales signals.
That disconnect gave us confidence to rebalance instead of abandoning position structure entirely.
📊 Where Things Landed
After the volatility:
Forecast stabilized near the ~97K range.
Probability spreads compressed across brackets.
Contract volume remained high — showing continued market attention.
Our repositioning helped:
✔️ Protect downside during peak volatility
✔️ Improve risk balance
✔️ Maintain flexibility if momentum shifts again
🎯 Current View
We’re treating last night as a market reset event, not a final signal on demand. Key things we’re tracking next:
Retail preorder behavior
Any new rollout or promotional activity
Whether the market starts rebuilding higher projections or confirms the lower baseline
💰 Profit Taken & Remaining Upside
During the projection crash, we locked in profits on portions of our position as volatility spiked, prioritizing capital protection while the market rapidly repriced. Taking profit during the sharp move allowed us to reduce risk exposure without fully exiting, which keeps us positioned for additional upside if sentiment rebuilds from this new baseline. With projections now stabilized near the high-90K range, the remaining position is structured to benefit if confidence returns and the market drifts back toward higher pure-sales brackets — meaning our downside is more controlled while upside potential remains open if momentum or new demand signals re-enter the market.
During the projection crash, we realized $193.25 in profit, using the volatility to lock gains while reducing exposure, and we’re now positioned to capture additional upside if the market rebuilds above the current ~97K forecast range.
🕒 Timestamp
Updated: Today — based on projection moves from 5:45 PM EST → 12:27 PM EST.
2/28: 2:50 PM Update
🚨 Direct-to-Consumer (D2C) Movement — Important Signal
A notable update from today’s tracking: the alternate D2C release (velvet sleeve / non-numbered edition) sold out earlier, and additional stock appears to have been added back to the site. That’s a meaningful development because D2C availability tends to move differently than Amazon or traditional distributors — and historically, these direct releases convert at a higher rate when inventory is available.
From a physical-media perspective, this is exactly the type of signal we monitor closely during release cycles. D2C buyers are typically more engaged fans, which means restocks don’t always sit long and often signal sustained demand rather than passive catalog sales.
📊 Why This Matters for Sales Tracking
When D2C variants move quickly:
Conversion rates are usually stronger than mass retail channels.
Purchases tend to come from core fans (higher probability of immediate buys).
It can influence early pure-sales momentum before broader retail numbers fully reflect demand.
In short — D2C activity is often an early indicator that physical demand is healthier than headline projections might suggest.
🧠 BeatRelease Analyst View
The fact that stock returned after an initial sellout is interesting:
It suggests additional inventory allocation rather than weak demand.
Fans who missed the first wave now have another opportunity — which can extend the buying window instead of compressing it into one spike.
Historically, when these drops are live and visible, conversion behavior improves compared to third-party sellers.
This is exactly why we continue monitoring direct-site movement alongside market projections — retail signals and trading sentiment don’t always move at the same speed.
📈 Positioning Note (Live Update)
We’re continuing to live-blog our position every few hours as new data comes in. D2C restocks like this are part of what we weigh when evaluating risk vs upside, especially as projections fluctuate. The plan remains flexible, but we’re watching closely to see whether physical demand signals like this create renewed momentum before midweek reporting.
📉
Trade Update — When the Thesis Breaks - Closing Notes
📉
Trade Update — When the Thesis Breaks
🧠 Initial Thesis
Going into this market, our original analysis leaned on a few key signals:
Bruno Mars historically performs very strongly in pure album sales.
Previous solo releases opened near 190K pure first week.
Tour demand and D2C activity suggested strong fan engagement.
Based on those factors, we initially believed the market was underestimating potential upside, particularly in the 100K–125K range.
⚠️ Where We Went Wrong
As the market evolved, projections began to collapse rapidly, eventually settling around the ~94K forecast range.
Despite these warning signs, we made the decision to hold exposure longer than our original risk framework intended, expecting a recovery toward historical norms.
Instead, the market continued repricing downward as new expectations formed.
This created a situation where our thesis — that historical demand would carry forward — did not materialize in the short term.
💰 Final Result
By the time the market stabilized, the position closed with an approximate:
📉 Loss of ~$835.92
While some lower-range brackets produced small gains, the larger exposure in the 125K band drove the overall result negative.
📊 What This Trade Taught Us
A few lessons stand out clearly from this market:
• Prediction markets price expectations — not history.
Past album launches don’t always translate directly to future demand.
• When projections collapse quickly, sentiment usually leads fundamentals.
• Risk management matters more than being right about the artist.
Even strong artists can underperform expectations when the market narrative shifts.

🔄 What Happens Next
We’ll be rotating focus toward new upcoming music markets, including future releases where liquidity and pricing inefficiencies tend to appear early.
Our strategy remains the same:
✔️ Track real retail signals
✔️ Monitor prediction market pricing shifts
✔️ Adjust positions quickly as new data appears
Not every trade works — but every trade provides information for the next one.
🕒
Update Timestamp
March 6 — 2:04 PM ET
Live updates will continue as we move into the next cycle of release markets.


Comments